Proc. of
Second World Avocado Congress 1992 pp. 281-288
Irrigation
and Fertilization Management of Avocados
Jewell
L. Meyer, Marylynn V. Yates, David E. Stottlemyer, and Etaferahu Takele
Department
of Soil and Environmental Sciences, University of California, Riverside, CA
92521, USA
Mary Lu
Arpaia
Department
of Botany and Plant Sciences, University of California, Riverside, CA 92521,
USA
Gary S.
Bender
Cooperative
Extension, University of California, Building 4, 5555 Overland Avenue, San
Diego, CA 92123, USA
Guy W.
Witney
Cooperative
Extension, University of California, 21150 Box Springs Road, Moreno Valley, CA
92387, USA
Abstract. An integrated
approach to determine the relationship between the amount of low-volume
irrigation water applied, fertility, yield, and root distribution was used in
this study. Four years of yield data have shown no significant increase in
total crop yield with water use above 100 percent ETc. Evapotranspiration has
averaged 70 cm depth of water. Fruit size at early harvest and root
distribution are significantly related to the amount of applied water.
California
is in the fifth year of critical water shortages. Research on the actual water
use for maximum yield of mature avocados has not been effectively conducted in
the past in California, nor has the interrelationship of yield, fruit quality
and fruit size, relative to water and fertility been investigated. The rapidly
escalating cost of water in California has narrowed grower margins of
profitability over the past decade. This project used an integrated approach to
evaluating amounts of water use, fertility, yield, fruit size, and root
distribution. Costs of water relative to yield (as related to this study) are
reported by Takele et al. (1992).
Materials and Methods
At Corona Foothill Ranch, Riverside County, an eight-year-old mature 'Hass' avocado (Persea americana Mill.) planting was selected for three irrigation treatments, 80 percent, 100 percent, and 120 percent of evapotranspiration (ETc). Three-row treatments with eleven replicates containing 20 trees per row were established in 1987. ETo (reference ET) was based on measurements taken nearby at the University of California, Riverside. The crop coefficients (Kc's) in the formula ETc = ETo x Kc were determined for Corona Foothill Ranch on a weekly basis using California Irrigation Management Information System (CIMIS, Snyder et al., 1985) ETo's and were correlated to tensiometer (30, 60, 90 cm) and neutron probe site readings (23-168 cm) (Richards and Marsh, 1961). CIMIS uses the modified Penman equation to determine the water use of a reference crop of 10 to 15 cm tall fescue (Penman, 1948). Nitrogen trials within each irrigation treatment were established at 0, 0.7, and 1.4 kg N/tree/year using soil applications of urea. Zinc treatments were 0 and 2.45 kg Zn/ha applied as a single foliar spray of zinc sulfate in June of each year. There were a total of 198 individual trees monitored for the irrigation/fertilizer treatments.
The trees have individual low volume sprinklers using 23 liter/hr heads located within 5 cm of the tree trunk. The radius of the wetted pattern averaged 1.83 m. The distribution uniformity, DU, (Merriam, 1981) was measured twice a year and has averaged 92 percent over the course of the experiment.
Irrigation water was applied in 24-hour increments as needed using tensiometer readings at the 1 2 to 30 cm depth in the wetted root zone (Marsh, 1981) in 100 percent ETc plots (i.e., tensiometer readings were not allowed to exceed 30 kPa), (Richards and Marsh, 1961). The applied water, ETaw, was calculated using ETaw = (ETo x Kc)/DU.
Leaf tissue analysis was determined annually for each tree in September. Yields were determined for each tree included in the fertilizer experiment at the three irrigation levels. In addition, total row yields were also collected for each replicate of the irrigation treatments. Multiple harvests were made each year, commencing when fruit reached minimum maturity based on dry weight (Ranney et al., 1992). Fruit were harvested based on size (minimum fruit weight 230 g) for the early harvests. Harvesting usually commenced in November and was completed in June.
Root
length was measured by using a 5.08 cm diameter bucket auger at two depths
(0-20 cm, 20-40 cm) and two distances (76 cm and 152 cm) from the trees in
seven replicates (Newman, 1966) for all irrigation treatments in July-August,
1990. Trees used in this study had all obtained the intermediate amount of
nitrogen (0.7 kg N/tree) and had also received the 0.7 kg/ha zinc application.
The root study compares total root length as a function of soil depth, the
distance from sprinklers, and irrigation treatment (Meyer and Peck, 1985).
Results and Discussion
The irrigation crop coefficients, Kc, for mature avocado trees from 1987-1991 are shown in Table 1. The relationship is Kc = ETc/ETo. The mean water usage, ETaw, from 1987-1990 is shown in Table 2. The total mean water applied for each irrigation treatment was 57.76 cm, 69.80 cm and 82.57 cm, respectively. This ETaw includes 8 percent additional applied water for distribution uniformity. The average annual rainfall at the site is about 250 mm/yr. However, rainfall in 1988 was 185 mm, 1989 was 89 mm, and 1990 was 150 mm. Rainfall is not included in the values reported in Table 2. Average total yield per each irrigation and fertilizer treatment is reported in Table 3. Although there are few statistical differences between any of the treatments for total yield, there was a significant difference in the amount of fruit harvested early in the season based on irrigation treatment (Table 4).
The differential nitrogen treatments did not affect yield; however, the irrigation water at the experiment contains 11 to 13 mg/L of N and probably accounts for the relatively high N tissue levels (Table 5).
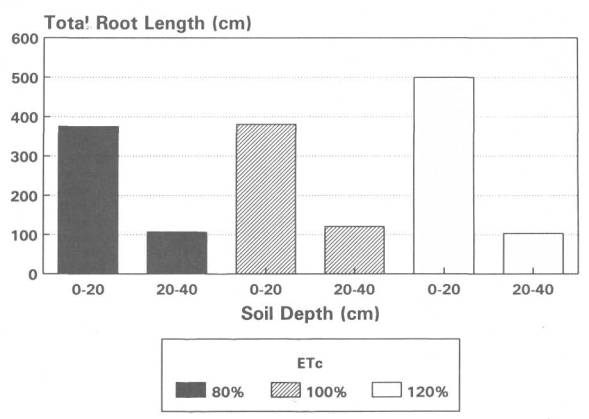
Total root length was measured as a function of distance from the sprinklers at the base of each tree and soil depth. Although the total root length based on irrigation level (Fig. 1) is not statistically significant, there were, however, more roots in the 1 20 percent ETc as compared to the 80 and 100 percent treatments. Proximity to the sprinkler significantly influences root distribution (P<0.01, Fig. 2). Depth also influenced root distribution. There were approximately four times more roots in the top 20 cm of soil as compared to the 20 to 40 cm depth for all irrigation treatments (Fig. 3). We observed a significant interaction between irrigation treatment and depth with regard to total root length (P<0.05).
This
difference is evident when comparing total root length for the top 20 cm of
soil for each irrigation treatment. The 120 percent ETc sample had a
significantly greater number of roots in the top 20 cm of soil as compared to
the top 20 cm of soil in the 80 and 100 percent ETc treatments.
Conclusion
The crop coefficients, Kc, of avocado vary seasonally between 0.35 and 0.55. The actual water requirement for maximum fruit size for early harvest is somewhat higher than previously believed. This study concludes that 120% of ET provides significantly higher early fruit yields, but overall 100% of ET maximizes total annual yield. This study did not show any significant interaction between nitrogen or zinc fertility nutrition practices and applied water.
The authors wish to acknowledge Staff Research Associate R. Strohman and Lab Assistant K. Carter for their valuable assistance in this project.
Literature Cited
Marsh, A.W. 1981. Questions and answers about tensiometers. University of California, Division of Agric. and Natural Resources Leaflet 2264 rev. 4 p.
Merriam, J.L., M.W. Whearer, and C.M. Burt. 1981. Evaluating irrigation systems and practices. ASAE Monograph 3, Chpt. 17. pp 130-143.
Meyer, J.L., and D. Peck. 1985. Avocado root distribution with mini sprinklers. Proceedings of Third International Drip/Trickle Congress, November 18-21, 1985, Centre Plaza Holiday Inn, Fresno, CA. ASAE. 2:682-686.
Newman, E.I. 1966. The method of estimating total root length. J. Applied Ecology 3:139-145.
Penman, H.L. 1948. Natural evaporation from open water, bare soils, and grass. Proc. Royal Soc. America 193:120-146.
Ranney, C.A., G. Gillette, A. Brydon, S. Mclntyre, O. Rivers, C.A. Vazquez, and E.Wilson. 1992. Physiological maturity and percent dry matter of California avocado. Proceedings of the Second World Avocado Congress, pp.379-385.
Richards, S.S. and A.W. Marsh. 1961. Irrigation based on soil suction measurements. Proc. of Soil Sci. Soc. America. 25:65-69.
Snyder, R., D.W. Henderson, W.O. Pruitt, and A. Dong. 1985. California Irrigation Management Information System. Final Report. Land, Air, and Water Resources Papers No. 10013-A, B, C. Dept. of Land, Air, and Water Resources. Univ. of Calif. Davis, CA.
Takele, E., J.L. Meyer, D.E. Stottlemyer, M.L. Arpaia, M.V. Yates, G.S. Bender, and G.W, Witney. 1992. Economic evaluation of integrated irrigation and fertilization practices of avocados. Proceedings of the Second World Avocado Congress, pp. 577-581.
|
Table 1. Avocado crop
coefficients (Kc) for CIMIS ETo. |
|||
|
Month |
Kc |
Month |
Kc |
|
January |
0.35 |
July |
0.55 |
|
February |
0.40 |
August |
0.50 |
|
March |
0.45 |
September |
0.45 |
|
April |
0.45 |
October |
0.45 |
|
May |
0.50 |
November |
0.45 |
|
June |
0.55 |
December |
0.40 |
|
Table 2. Mean water use
(irrigation) in cm for 1987-1990, Corona Foothill Ranch, CA.z |
|||
|
Month |
% ETc |
||
|
80% |
100% |
120% |
|
|
January |
1.13 ± 0.76 y |
1.39 ± 1.02 |
1.56 ± 1.21 |
|
February |
2.85 ± 0.25 |
3.27 ± 0.31 |
3.58 ± 0.61 |
|
March |
2.66 ± 1.85 |
3.25 ± 2.28 |
3.83 ± 2.66 |
|
April |
3.78 ± 1.52 |
4.74 ± 1.93 |
6.02 ± 1.93 |
|
May |
5.65 ± 1.51 |
6.87 ± 1.84 |
8.13 ±.2.41 |
|
June |
7.60 ± 0.54 |
9.37 ± 0.82 |
11.07 ± 1.07 |
|
July |
9.12 ± 0.41 |
11.17 ± 0.61 |
12.99 ± 1.06 |
|
August |
7.87 ± 0.33 |
9.49 ± 0.92 |
1.11 ± 1.42 |
|
September |
6.89 ± 1.48 |
8.16 ± 1.30 |
9.44 ± 1.68 |
|
October |
4.89 ± 1.43 |
5.90 ± 1.98 |
6.97 ± 2.13 |
|
November |
3.54 ± 1.13 |
4.27 ± 1.27 |
5.23 ± 1.66 |
|
December |
1.78 ± 0.79 |
2.19 ± 1.09 |
2.64 ± 1.29 |
|
Total |
57.76 |
69.80 |
82.57 |
|
z Corrected for 92% irrigation
uniformity. y ± Standard deviation. |
|||
|
Table 3. Average yield
data (kg/ha) for 1988-1990 per irrigation and nitrogen treatment.z |
||||
|
Treatment |
1988 |
1989 |
1990 |
Total |
|
Irrigation (%) |
||||
|
80 |
9,471 |
4,184 |
7,713 |
21,369 |
|
100% |
7,839 |
6,004 |
7,021 |
20,863 |
|
120% |
9,351 |
4,113 |
8,917 |
22,381 |
|
Significance |
N.S.Z |
N.S. |
N.S. |
N.S. |
|
Ly |
N.S. |
N.S. |
N.S. |
N.S. |
|
Qx |
N.S. |
*w |
N.S. |
N.S. |
|
Nitrogen (kg/tree) |
||||
|
0.0 |
9,010 |
4,291 |
8,521 |
21,822 |
|
0.7 |
8,941 |
5,829 |
7,297 |
22,066 |
|
1.4 |
8,710 |
4,182 |
7,834 |
20,726 |
|
Significance |
N.S. |
* |
N.S. |
N.S. |
|
L |
N.S. |
** |
N.S. |
N.S. |
|
Q |
N.S. |
N.S. |
N.S. |
N.S. |
|
Zinc (kg/ha) |
||||
|
0.00 |
8,272 |
5,426 |
7,951 |
21,651 |
|
2.45 |
9,502 |
4,108 |
7,816 |
21,425 |
|
Significance |
N.S. |
N.S. |
N.S. |
N.S. |
|
L |
N.S. |
N.S. |
N.S. |
N.S. |
|
Q |
N.S. |
N.S. |
N.S. |
N.S. |
|
Interaction |
|
|
|
|
|
I*N |
N.S. |
N.S. |
N.S. |
N.S. |
|
l*Zn |
N.S. |
N.S. |
N.S. |
N.S. |
|
N*Zn |
N.S. |
* |
N.S. |
N.S. |
|
l*N*Zn |
N.S. |
N.S. |
N.S. |
N.S. |
|
z N.S. = Not significant y L = Linear x Q = Quadratic w *, **, *** = P< 0.05,
0.01, 0.001, respectively |
||||
|
Table 4. Average yield per
tree (kg/tree) per irrigation treatment for early avocado harvest, Corona
Foothill Ranch, CA. |
||||
|
|
1989-90 |
1990-91 |
||
|
Etc (%) |
11/89 |
1/90 |
12/90 |
3/91 |
|
80 |
1.248 |
0.539 |
0.406 |
0.399 |
|
100 |
2.311 |
1.028 |
0.964 |
0.998 |
|
120 |
3.283 |
1.297 |
0.806 |
1.700 |
|
Significance |
***z |
*** |
N.S. |
** |
|
Ly |
*** |
*** |
N.S. |
*** |
|
Qx |
N.S.w |
N.S. |
N.S. |
N.S. |
|
z *, **, *** = P< 0.05, 0.01, 0.001, respectively. y L = Linear x Q = Quadratic w N.S. = Not significant |
||||
|
Table 5. Total N (%) based
on fall leaf analysis, Corona Foothill Ranch, CAz. |
||||
|
N applied (kg/tree) |
1987 |
1988 |
1989 |
1990 |
|
0.0 |
1.87 |
1.98 |
1.92 |
1.81 |
|
0.7 |
1.84 |
2.12 |
2.10 |
2.06 |
|
1.4 |
1.87 |
2.19 |
2.19 |
2.09 |
|
Significance |
N.S.z |
***w |
*** |
*** |
|
Ly |
N.S. |
*** |
*** |
*** |
|
Qx |
N.S. |
N.S. |
* |
*** |
|
z There were no significant effects
of differential irrigation or zinc application on leaf nitrogen levels, nor
were there any significant interactions detected. y L = Linear x Q = Quadratic w *, **, *** = P< 0.05, 0.01, 0.001, respectively. |
||||
Figure 1. Total root length based on irrigation
treatment (% ETc). Roots were collected July-August, 1990. Data presented are
the mean of seven replicates.
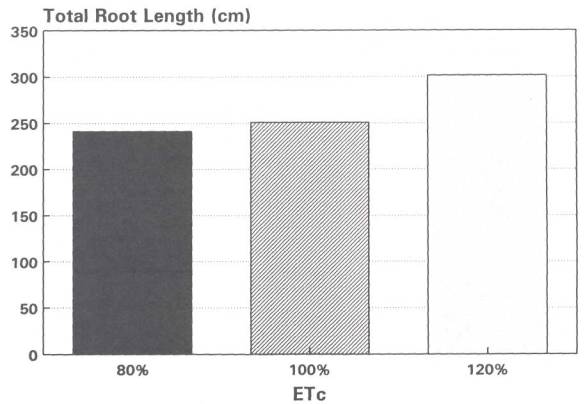
Figure 2. Total root length based on soil depth (0-20
cm; 20-40 cm) and distance from the low volume sprinkler (76cm, 152 cm). Roots
were collected July-August, 1990. Data presented are the mean of seven
replicates.
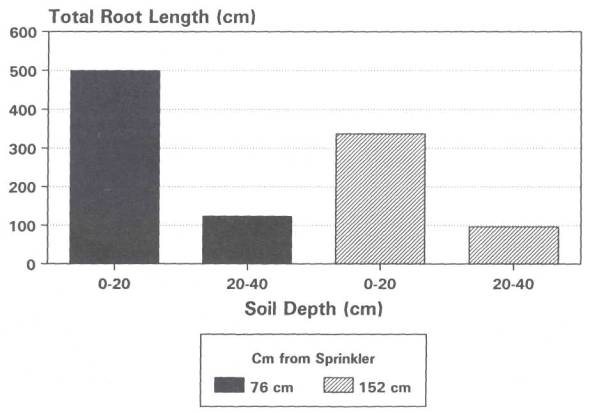
Figure 3. Total root length based on soil depth (0-20
cm; 20-40 cm) and irrigation treatment (% ETc). Roots were collected
July-August, 1990. Data presented are the mean of seven replicates.