Proceedings
of The World Avocado Congress III, 1995 76-79
AVOCADO
TREE GROWTH CYCLES - A QUANTITATIVE MODEL
T.G.
Thorp, P. Anderson and M. Camilleri
The Horticulture and Food Research Institute of New
Zealand Ltd.
Private Bag 92 169
Auckland
New Zealand.
Abstract
Avocado tree
growth cycles were quantified over two growing seasons. Major phenological
events were selected to define the beginning and end of individual growth
flushes, and logistic curves were fitted to enable statistical comparisons of
growth cycles to be made. Root growth was observed in small rhizotrons located
beneath the leaf litter, and records were made of the number and rates of
extension of individual roots. Growth cycles were similar in the two seasons.
Flowering occurred during the first week of November (late spring), with root
and shoot growth flushes in October/November and February/March (summer). Thus,
maximum root growth coincided with flowering, and with the spring and summer
growth flushes of shoot growth.
Additional
index words
Avocado,
Persea americana, phenology, root growth.
Introduction
Correct timing of
management operations is the key to successful avocado production (Whiley et
al., 1988; Graham and Wolstenholme, 1991; Wolstenholme and Whiley, 1989). Trees
should be planted, pruned, irrigated, fertilised and sprayed according to
specific stages of shoot growth or flowering. Fertiliser applications and root
rot control should be timed to coincide with flushes of root growth. Computer
based decision support systems are now available to help growers make these
management decisions on time and with confidence (Mulo et al., 1995). However,
these systems rely on accurate descriptions of tree growth cycles. Often these
are not available. This paper describes a new method of describing avocado
growth cycles that enables statistical comparison of growth flushes or their
component parts.
Materials
and Methods
Cycles of shoot and root growth and flowering were
recorded over 3 years (1993- 95) on 12 'Hass' trees grafted on 'Zutano'
seedling rootstocks. Trees were planted in 1988, in the Bay of Plenty, New
Zealand (lat. 37ºS, long 176ºE).
Shoot growth and
flowering were recorded as the proportion of the tree canopy at a specific growth
stage. Shoot growth stages were: Dormant; Bud Break; Shoot Extension; Apical
Bud Set (end of shoot extension); and Flush Mature (leaves green)(Thorp et al.,
1994). For flowering, we recorded the proportion of floral and non-floral buds
involved in each growth flush, and the proportion of floral buds (inflorescences) that had
10%, 50% and 90% of their flowers at M bloom or post- anthesis.
Growth cycle
data were transformed to produce symmetrical bell-shaped curves (logistic
curves) illustrating times of peak activity for each growth phase (Schirone et
al., 1990). This type of curve approaches but does not reach zero, so a 98%
interval was used to show the duration, and start and finish dates for each
growth flush. The area under the curve shows the percentage of canopy involved
in each growth flush, while the daily growth rate (vertical axis) is the
percentage of the total growth flush completed each day.
Root growth was
measured using small rhizotrons; placed against the soil surface beneath each
of the measurement trees. Rhizotrons consisted of a sheet of propagation foam
(45Ox450xl5mm) covered with glass and then covered with wet carpet underlay to
retain moisture and exclude light. New root growth that was visible against the
glass was traced onto sheets of acetate every 3-4 weeks. Daily growth rates
were determined from roots present at the previous tracing. We then used the
growth rates of "previous" roots to estimate growth rates of
"new" roots, i.e. those not present at the previous tracing. Combined
data for "previous" and "new" roots is presented in
graphical form, as the total length of new root growth at each window per day.
All rhizotrons required a "settling in" period of several weeks as
roots adjusted to their new environment. Data from this period were not
included in our analyses.
Results
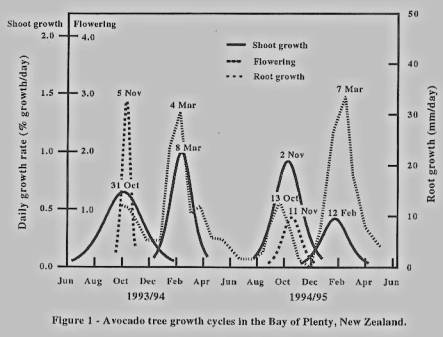
In each year
there was a clear overlap between flowering and the period of maximum shoot
growth (figure 1). Peak activity for flowering (when 50% of flowers had opened)
occurred on 5 and 11 November in 1993 and 1994 respectively. Spring shoot
growth peaked on 31 October 1993 and 2 November 1994, at which stage shoots and
leaves were rapidly expanding. Flowering occurred over 70% and 47% of the
canopy in 1993 and 1994, with heavy winter frosts reducing flowering in 1994.
Spring shoot growth involved 75% and 73% of -the canopy in 1993 and 1994,
respectively. Summer growth flushes occurred in both years with peak activity
occurring on 8 March 1994 and 12 February 1995, involving 63% and 33% of the
canopy, respectively.
Root growth was
cyclic, with two peaks of activity in each of the two years. All four peaks
coincided with periods of rapid shoot growth in spring and summer, and with
flowering in spring. Although the first peak in 1993 was not clear, the timing
and magnitude of root growth at this stage was similar to the first peak in
1994. Root growth in summer reached 34 mm/day, compared with just 13 mm/day in
spring. Growth rates dropped to almost zero between these periods of rapid
growth.
Discussion
The
consistency of results from the two years suggests that a single growth model
is feasible for an orchard and possibly a region. At our site this model would
involve one period of flowering and two flushes of root and shoot growth. Full
bloom would be in the
first week of November, with root and shoot growth flushes in October/November
and February/March.
This growth
pattern is different from that recorded elsewhere in New Zealand (unpublished
data) and in Queensland, South Africa and California (Whiley et al., 1988;
Graham and Wolstenholme, 1991; G. Witney, pers. comm.). In these regions, root
growth follows shoot growth. Thus, management techniques that target root
growth are applied when shoot growth has matured. In our model, where root
growth coincides with shoot growth, these management practises should be timed
to coincide with the onset of shoot growth. Differences between regions are
probably due to environmental influences, although experimental method may also
be important (Harris et al., 1995).
Clearly, growers
need to record the timing of growth cycles on their own orchards. These can
then be averaged, using standard statistical methods to produce a model for a
region. Our method involves regular observations of complex phenological sequences.
If regional growth charts were available, then growers would only need to
record the progression of single events, such as inflorescence or shoot
extension. These could then be compared with a regional growth chart to predict
the timing of growth cycles on individual orchards. To make these predictions
as early as possible, it would be better to plot the progress of bud break, the
earliest phenological stage. Unfortunately, this event is difficult to define
and can take several months to progress. Also, early bud break may not
correspond with early flowering.
Although the
logistic curve we used is a mathematical model, the growth pattern it portrays
is an accurate representation of what happens in the orchard. Growth is relatively
slow at the start of a growth cycle, reaches a peak of activity in the middle,
and is followed by a gradual decline. An important feature of the logistic
curves is that they allow statistical comparison and averaging of growth curves
from different years. Generic models can then be produced to predict growth
patterns. Also, similar analyses applied to individual growth stages (such as
bud break or shoot extension) allow their progress to be compared against the
complete growth cycle.
The Queensland system for recording root growth is based upon casual observations of root growth beneath sheets of newsprint (Whiley et al., 1988). This method will not accurately predict peaks in root activity, as it is not possible to ensure consistency between one observation and the next. Our method of root growth measurement is quantitative, and ensures consistency between measurements. We found that the number of active roots mirrors the daily growth rates plotted on our charts. Thus, if growers wish to record cycles of root growth we recommend that they count the number of active roots (those with white root tips), using rhizotrons similar to those used in our study. This method will underestimate the magnitude of root growth flushes, but it will accurately show the timing of maximum root activity.
In conclusion,
our method for recording avocado tree growth cycles is simple and robust. It
will be useful to scientists and growers wishing to accurately record growth
events occurring above and below ground.
Acknowledgements
We acknowledge the financial assistance of the NZ
Avocado Growers'Assn.
Reference
Graham, A.D.N., and
Wolstenholme, B.N., 1991. Preliminary results on the influence of late hanging
of Hass avocados (Persea americana Mill.) on tree performance. South
African Avocado Growers'Ass. Yrbk. 14:27-37.
Harris, J.R., Bassuk, N.L.,
Zobel, R.W., and Whitlow, T.H., 1995: Root and shoot growth periodicity of
green ash, scarlet oak, Turkish hazelnut, and tree lilac. J.Amer.Soc.Hort.Sci.
120(2):211-216.
Mulo,
S., and Newett, S., 1995. The AVOMAN Software. Talking Avocados,
Australian Avocado Growers'
Fed. 6(2):8-12.
Schirone, B., Leaone, A.,
Mazzoleni, S., and Spada, F., 1990. A new method of survey and data analysis in
phenology. J. Veg. Sci. 2:27-34.
Thorp, T.G., Aspinall, D.,
and Sedgley, M., 1994. Preformation of node number in vegetative and
reproductive proleptic shoot modules of Persea (Lauraceae). Ann. Bot. 73 (1)
:13-22.
Whiley, A.W.; Saranah, J.B.;
Cull, B.W., and Pegg, K.G., 1988. Manage avocado tree growth cycles for
productivity gains. Qld. Ag. J. Jan-Feb :29-36.
Wolstenholme,
B.N., and Whiley, A.W., 1989. Carbohydrate and phenological cycling
as management tools for
avocado orchards. Sth.Afr.Avocado Growers' Ass.Yrbk.
12 :33-37.