Proceedings of The World Avocado Congress III, 1995
189- 195
IRRIGATION MANAGEMENT OF AVOCADO IN A CALIFORNIA
COASTAL ENVIRONMENT
B.A. Faber
U. C. Cooperative
Extension
County Sq. Dr.
Ventura, CA 93003, U.S.A.
M.L. Arpaia
Botany & Plant Sci. 669
University of Calif.
Riverside, CA 92521, U.S.A.
M.V. Yates
Soil
& Envi. Sci.
University
of Calif.
Riverside,
92521, U.S.A
Additional index words: Persea
americana, Hass, evapotranspiration, salinity, tree size
Abstract
Hass avocado trees have been
irrigated differentially for four years. The seven levels of irrigation based
on a percentage of reference evapotranspiration (ETo) have resulted
in significantly different tree size, stomatal conductance, soil tension,
tissue chloride, and soil salinity. Only in the fourth year has there been a
significant effect on cumulative yield. The higher levels of irrigation have
resulted in trees with a significantly reduced yield per canopy volume.
1. Introduction
Competition for water and increasing need for a competitive agriculture are forcing all aspects of avocado production to be reexamined in California, especially irrigation management Unfortunately, the avocado tree along with many tree crops does not lend itself easily to irrigation studies, due to alternate bearing and the need to measure parameters over several years. Richards et al. (1958) irrigated avocados at 0.5, 1 and 10 kPa over an eight year period and found only slight yield differences in the combined sixth and seventh harvests between the 0.5 and 1 kPa treatments, but a 60% difference in water applied. Most of the treatment difference was found in trunk growth differences. In an area of expensive water, it could be a rational economic trade to apply substantially less water to obtain only a mildly reduced yield.
It would be nice if we had a
clearer picture of the effect of water on fruit yield, size, quality and plant
growth, but this is not the case. In general, tree size and trunk circumference
is correlated to applied amounts (Richards et al., 1958; Lahav et al., 1977;
Olalla et al., 1992; Lahav et al., 1992; Kurtz et al.,
1992). This growth
response depends on tree variety. Lahav et al.(1992) showed Hass to be much
more responsive to applied amounts than Fuerte, and although Kurtz et al.
(1992) showed a positive growth response to applied water in Ettinger, Hass and
Fuerte had variable responses.
Yield response is even more
variable. Lahav et al. (1992) demonstrated yield response in Fuerte and Hass at the
highest applied amounts, but Kurtz et al. (1992) found that although Ettinger
responded at the highest amount applied, Fuerte and Hass were relatively insensitive.
Lahav et al. (1977) found a yield response in an application timing trial, but
a third less water was also applied between the most and least frequent
application times. Adato et al. (1988) found Fuerte had more fruit, larger
fruit and larger yields, as well as earlier fruit maturity at 0.46 versus 0.64
of a Class A pan.
Differences in fruit response may have something to
do with how irrigations are scheduled. Weather-based methods have been used by
Adato et al. (1988), Olalla et al. (1992) and Kurtz et al.
(1992); while
Richards et al. (1958) and Lahav et al.(1992) used soil-based schedules. Kalmar
(1977) used application frequency with a fixed application amount at an
irrigation. Differences may also be due to any number of other factors, such as
trial duration, water quality, soil type, climate, and type of emitter. In order to help growers schedule irrigations for
optimum yield in a California coastal environment, a trial was established in
1991 that will continue through fall of 1996. The area is located approximately
100 kin north of Los Angeles.
2. Materials and methods
A 1.74 ha Hass test block on interplanted Duke 7 and Mexican seedling rootstock is being studied near Camarillo, CA. The trees are planted on a 6.8 X 6.8 m grid. The site is in a small valley 3 km from the Pacific Ocean. The soil is a loam with sandstone fragments that exceeds 2 m in depth (Malibu series; coarse-loamy, montmorillonitic, thermic Abruptic Palexerols). Rainfall averages 400 mm, although 1991 and 92 were low rainfall years and 1993, 94 and 95 substantially exceeded the average. Annual temperature ranges between 21º and 27ºC in July, dominated by morning fog. Average minimum temperature is 4ºC. Irrigation water quality varies from 1.2 to 1.6 dSm-1, with calcium as the dominant cation.
In summer 1991, 6-year old trees which had been
irrigated as a single block were replumbed as 15 separate irrigation blocks.
Thirty contiguous trees, three rows with 10 trees each, were randomly
designated to receive different amounts of irrigation water. The trees were of
an equivalent size. The test was designed for three irrigation rates to be
determined by a percentage of reference evapotranspiration (ETo) - 40%, 60% and
90% of ETo. There were five replications of each treatment.
Instead of the intended three levels of irrigation,
when the system was turned on, the treatments became a continuum from 37% to
185% of ETo. This was due to the variable friction loss resulting from the
different lengths of pipe running to the different blocks. Some blocks had very
similar application amounts, and the result was 10 blocks that
would
allow a regression analysis rather than the intended analysis of variation.
The irrigation rate for each treatment is regulated
by an automatic metering valve (Bermad 900-D, Control Valves, Anaheim, CA)
which controls water to separate flow meters for each of the 15 blocks. Each
tree is irrigated with a 45 lh-1 microsprinkler.
ETo is available from a
nearby California State Department of Water Resources weather station, as well
as onsite Class-A evaporation pan and atmometer. The trees are irrigated on a
weekly basis during the irrigation season. Weekly tensiometer readings are made
in each block at a designated tree. Tensiometer depths are 20, 60 and 90 cm.
During each irrigation season, stomatal conductance (Licor, Ll- 1600, Lincoln, NE) measurements were made mid-morning the day prior to irrigation. In August of each year, leaf samples were collected for tissue analysis and tree canopy measurements made. Harvest yield weight and fruit size were made in the fall of each year. All measurements were made on the middle row of 10 trees in each block.
In 1992 and 1994, at the end of the irrigation
season, soil samples were taken from three trees in the 37, 70 and 100%
treatments. Sampling was done at three depths, 0-15 cm,
15
to 30 cm, and 30 to 45 cm. Samples were taken at distances of 0, 1, 2 and 3.3 m
in a transect from the microsprinkler. Soils were analyzed for salinity.
3. Results
3. 1. Irrigation design and
its effect on treatments
The number of blocks was
further reduced when in 1995, it became obvious from
tree size and yield measurements that a eucalyptus
windrow was having significant effects on the three nearest blocks. Further
results reported here will be based on ETo percentages of 37, 46, 63, 70, 75,
100 and 111 %.
3.2. Treatment effect on
fruit yield, fruit size and canopy volume
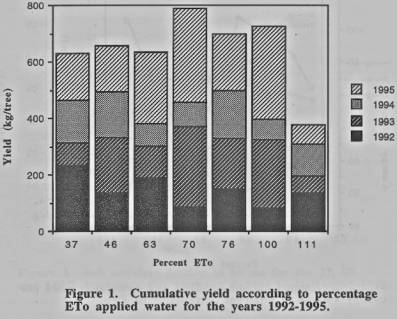
Annual and cumulative harvest yields (figure 1) were
not dramatically affected by treatment, although there is a somewhat
curvilinear response which conforms to a second order polynomial regression of y=6.47+2123.97x-
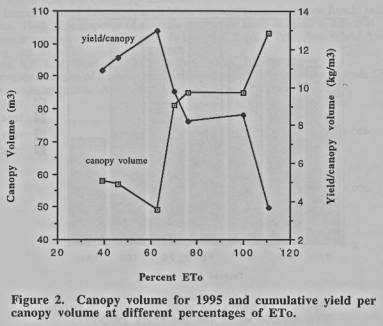
1542.34x2 with a coefficient of determination of 0.61. More clearly affected
was canopy volume (figure 2) which had a coefficient of determination of 0.74,
a closely linear response of tree size to treatment. Yield per canopy volume
(figure 2) had a negative correlation with a correlation of determination of
0.67. 'Mere was little correlation between yield and fruit size.
3.3. Indicators of tree
stress
Although no visual rating of
tree response to irrigation treatment has been made, the trees receiving 37 and
46% ETo had thinner canopies and noticeably more tip bum in all years. Tissue
chloride levels had a coefficient of determination of 0.85 with the 37 % trees averaging 0.59%
chloride and the 111%, 0.32%. Porornitry consistently indicated lower levels of
stomatal conductance in the two lowest irrigation treatments.
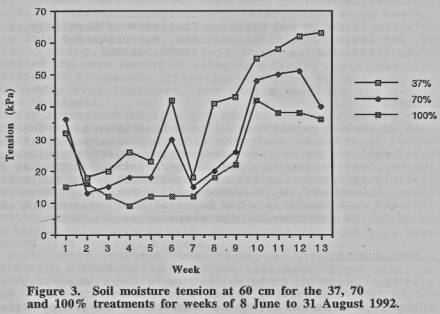
Soil moisture tension (figure
3) as can be seen in the 60 cm readings for the irrigation season of 1992 as an
example, were consistently lower for the 100% trees than the 37 and 70%
treatments. Soil salinity sampling in both 1992 and 1994 resulted in highly
variable salinity patterns, with the treatments 70,75, 100 and 111% having much
lower salinities within the 0 to I m distance from the emitter at all depths,
but higher in the 2 to 3.3 m distance at some depths.
4. Discussion
It has taken four years of
imposed treatments for the cumulative yields to show a significant difference
in treatment. This points out the need for long term studies in tree trials.
Much of the yield difference is due to the substantially larger trees that
result with more water. In fact, at 111% ETo it appears the trees have
sacrificed yield in favor of growth. The trees receiving less than 70% ETo are
significantly smaller and show the stress of chloride accumulation and lack of
adequate leaching.
This study is not completed. The tree canopies in
the 110% treatments are touching and the 70, 76 and 100% ETo trees are not far
behind. This will entail either a thinning of the orchard or more likely some
pruning program. However, if the economics of increased pruning and the cost
and availability of water are such that the water-stressed trees give a higher
return to the grower, the reduced water treatments may be the grower's choice.
This would need to be made on purely an economic
basis, since esthetically the high water treatment trees looked better.
According to tensiometer
data, in adequate rainfall years, trees begin water stressing only by mid-July
in this area. This is because the trees can fully use the stored soil moisture
from rains. By mid-July, the trees are reliant primarily on the irrigation
water. During four years of this trial, we have had the first rains in either
September or October. This means the trees are significantly reliant on irrigation
for only about a two to three month period in adequate rainfall years.
Recognizing this period of
dependency, it might be possible to maximize water use by withholding or
ensuring applied water at certain times of the year. However, an optimum water
strategy will not be available until we better understand the phenology of
avocado and its varieties. Only then will it be known how to fully manipulate
irrigation in such fashions as controlled deficit irrigation.
References
Adato, I and B. Levinson. 1988. Influence of daily
intermittent irrigation on avocado
Lahav, E. and D. Kalmar.
1977. Water requirements of avocado in Israel. 111. Influence on yield, fruit
growth and oil content Aust. J. Agric. Res. 28:869-877.
Lahav, Emmanuel, Reuven
Steinhardt and Dov Kalmar. 1992. Water requirements and the effect of salinity
in an avocado orchard on clay soil. In Lovatt, C.J. (ed.), Proc. Sec. World
Avocado Cong. pp. 323-330.
Olalla, Leandro, Angel
Salazar, Araceli Mira, Miguel Martin, Francisco Jurado and Carlos Lopez. 1992.
The response of avocado trees in the south of Spain to different irrigation
regimes and wetted areas. In Lovatt, C.J. (ed.), Proc. Sec. World Avocado Cong.
pp. 317-322.
Richards,
S.J., L.V. Weeks and J.C. Johnson. 1958. Effects of irrigation
treatments and rates of nitrogen fertilization on
young Hass avocado trees: 1. Growth response to irrigation. Amer. Soc. Hort.
Sci., Proc. 71:292-297.